End of Gallery
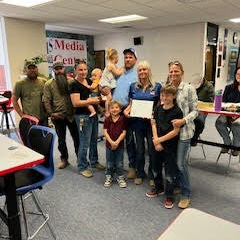
NAURRC Support Staff of the year
Elizabeth Thies is MVESD Transportation Coordinator, she's transformed operations, secured $4.4M in grants, improved communication, enhanced safety, and fostered community collaboration. Her visionary leadership sets a standard for rural districts nationwide. She's a true asset to our school community.
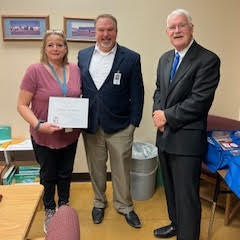
Irma, with 27 years of dedication, excels in accounting and takes on diverse roles, managing the cafeteria, migrant program, and 8th-grade activities. Her commitment to professional development ensures a safe and inclusive environment. A respected member of the community, Irma is integral to our school's success.
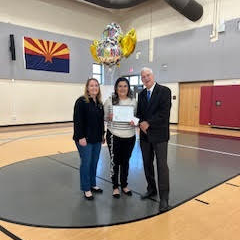
Hallie, at Antelope Union High for 50 years, is indispensable. Managing testing, tutoring, media, tech support, and more, she's the go-to person for students and staff. Her warmth, dedication, and impact on countless students make her an invaluable asset to the school community.